
SITE UNDER CONSTRUCTION…
Excuse the mess — this page is under construction. I hope that it will be a place to share visual and text snapshots of my work. Eventually it might evolve into tutorials. In the meantime, pop over to the “tools” page for recommended software and toolboxes, or over to my Github for a (also under construction) repository of signal processing functions for MATLAB.
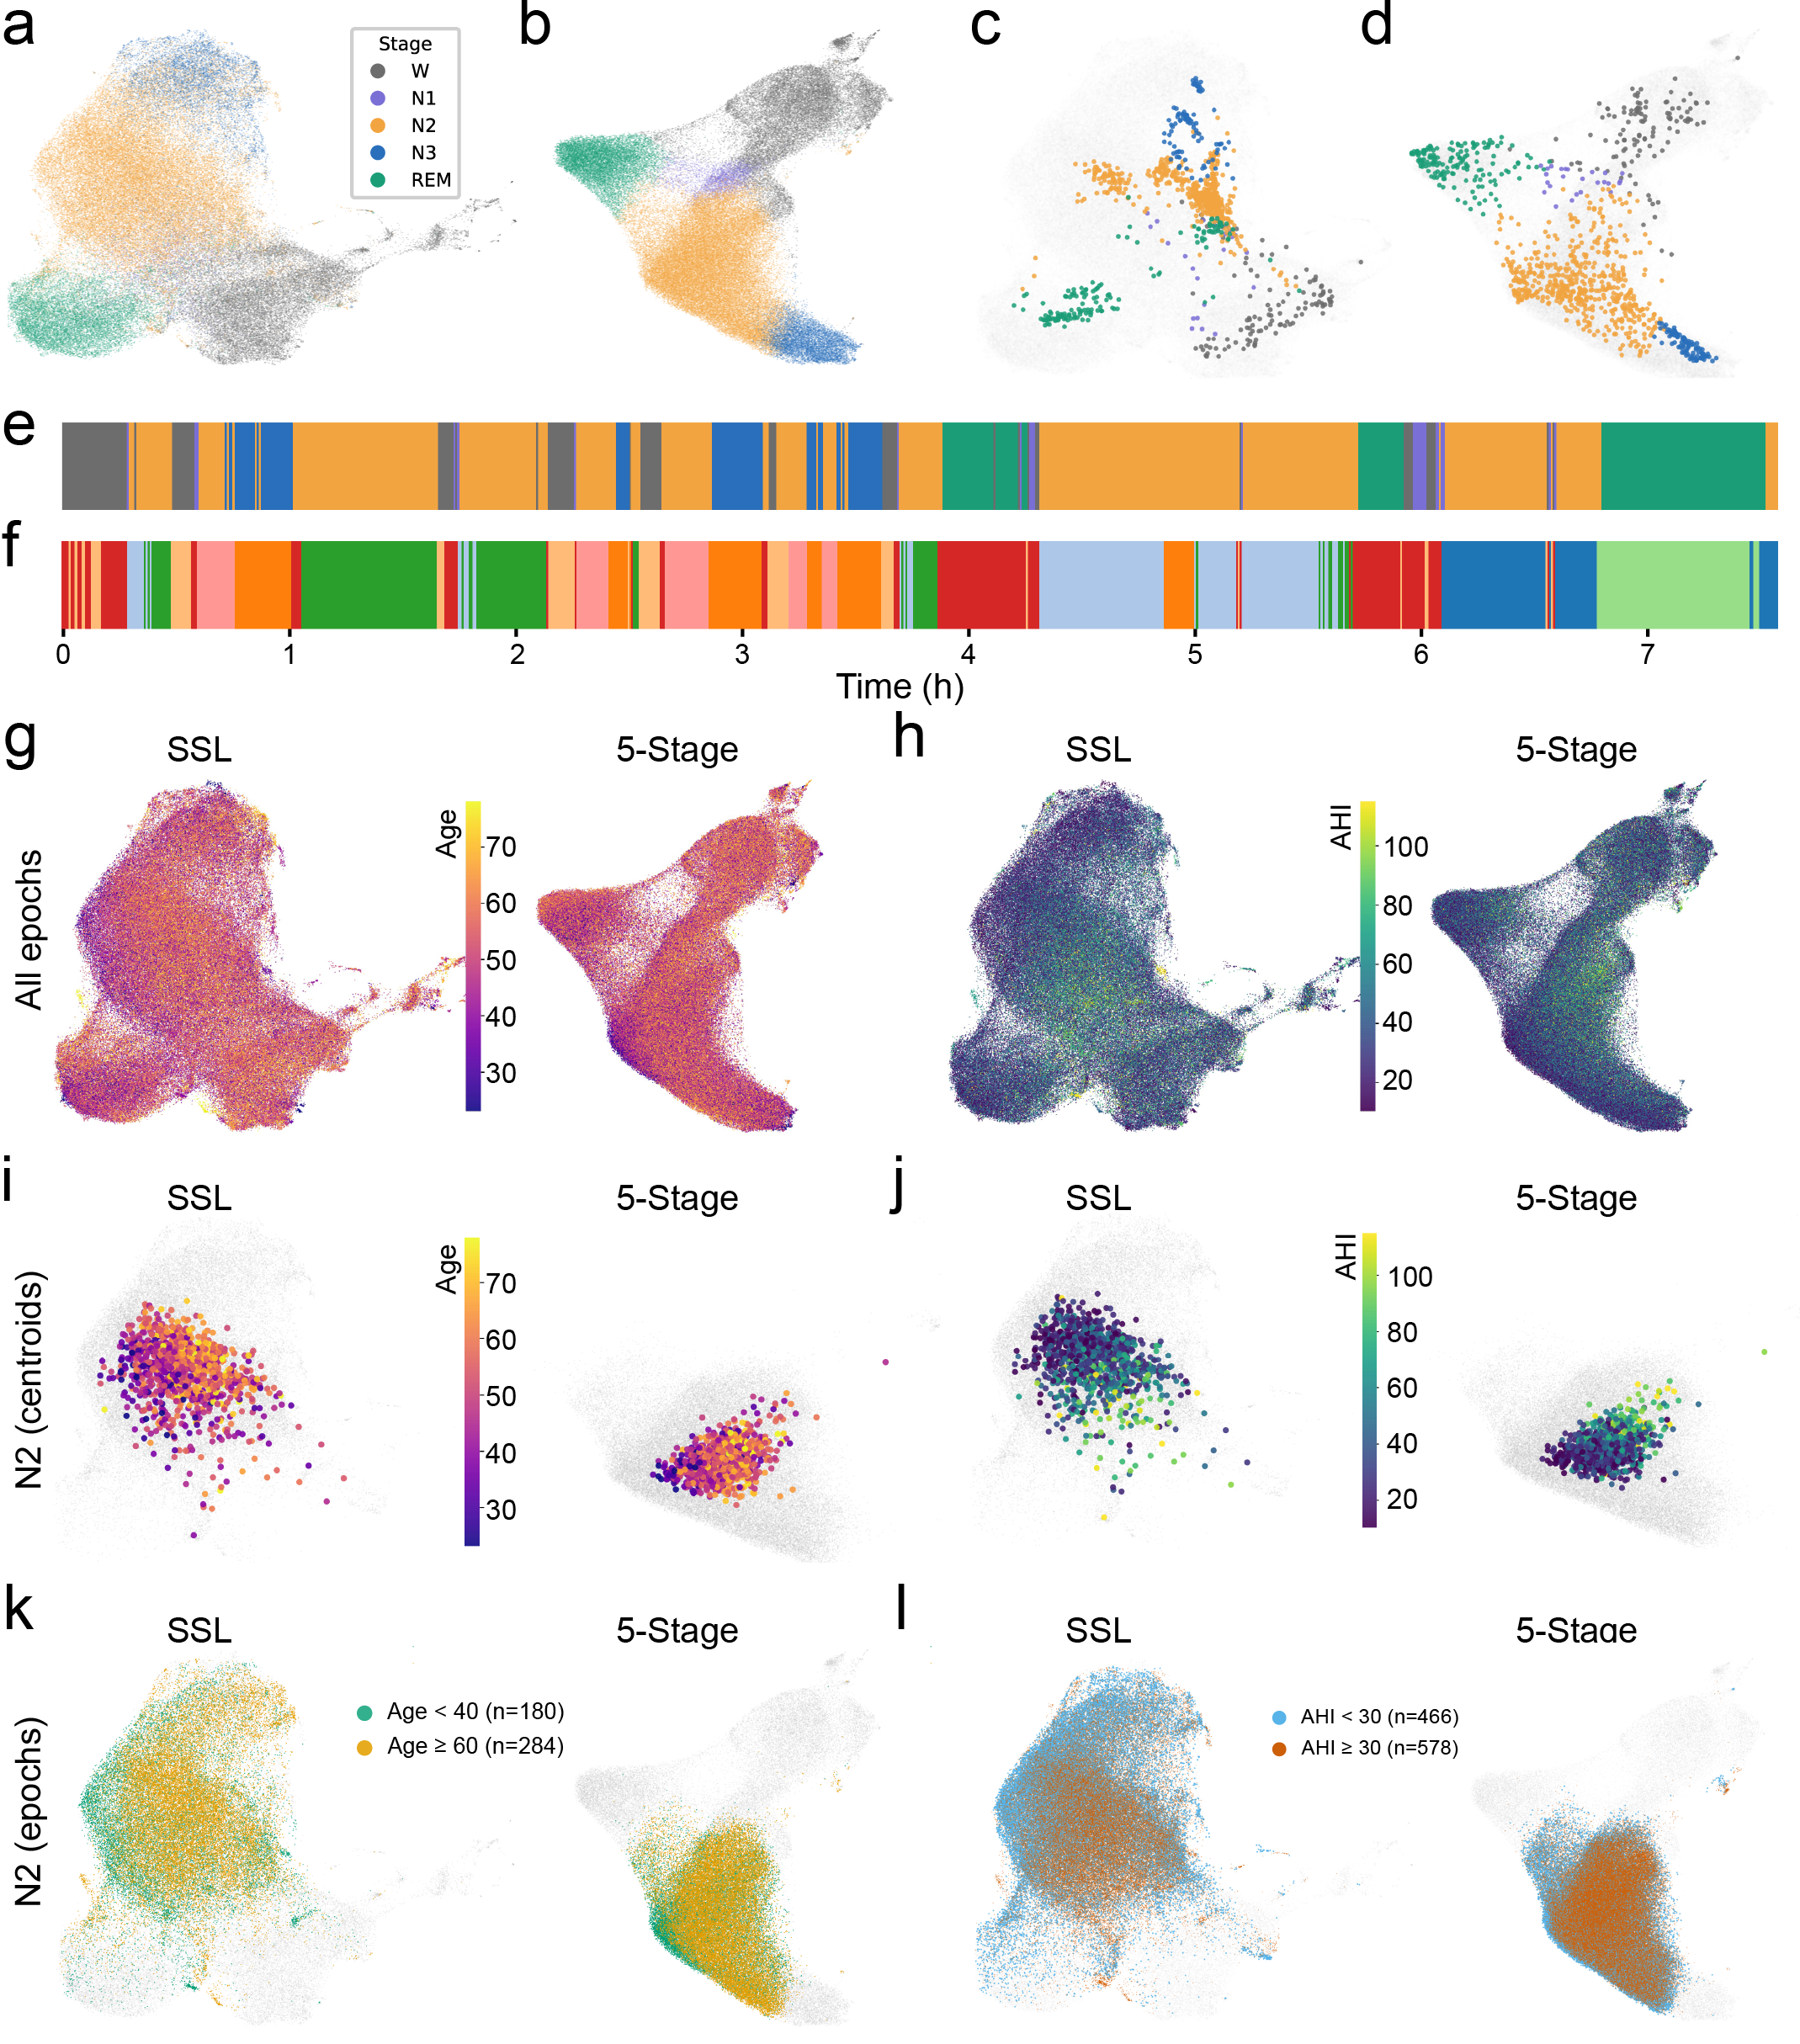
Global sleep embedding atlases and an example subject’s projections onto SSL and five-stage manifolds. (a,b) Two-dimensional UMAP projections (“global manifolds”) of 30-s EEG epoch embeddings from a foundation model pretrained with self-supervised learning (SSL; a) and a matched model trained with five-class sleep stage supervision (five-stage; b). Points show all epochs used to form the global atlases and are colored by five-stage sleep labels (Wake, N1, N2, N3, REM). (c) A representative subject’s SSL embeddings projected onto the SSL global manifold and colored by that subject’s five-stage labels, illustrating where this night’s epochs fall within the population-level SSL geometry. (d) The same subject’s five-stage embeddings projected onto the five-stage global manifold and colored by five-stage labels. The SSL embedding in (c) forms compact, well-separated microstate islands, whereas the stage-supervised embedding in (d) shows greater dispersion and overlap among microstates, consistent with reduced expression of fine-grained structure under five-stage supervision. (e) The subject’s five-stage hypnogram across the night (30-s epochs), using the same stage color scheme as panels (a–d). (f) The subject’s corresponding microstate timeline, using arbitrary colors; each color corresponds to one of this subject’s microstates.
Example phenotype overlays on the global embedding atlases. (g) Left: SSL global manifold; right: five-stage global manifold. Colored overlays illustrate continuous phenotype structure for age. (h) Same as in (a), but overlaid colors represent AHI in the same cohort (APPLES). (i) SSL and 5-stage manifolds for N2 only shown in light gray background. Colored overlays illustrate subject-level embedding centroids from N2 sleep, colored by ground truth Age. (j) same as (c), but colors show subjects’ AHI scores (ground truth). (k) SSL and 5-stage global manifolds shown in light gray background. Colored overlays illustrate binarized phenotype (Age) from N2 sleep epoch embeddings. (i) Same as (e), but colors show binarized AHI in the same cohort.
Our sleep wearable: realtime sleep stage classification, open-source forehead EEG!

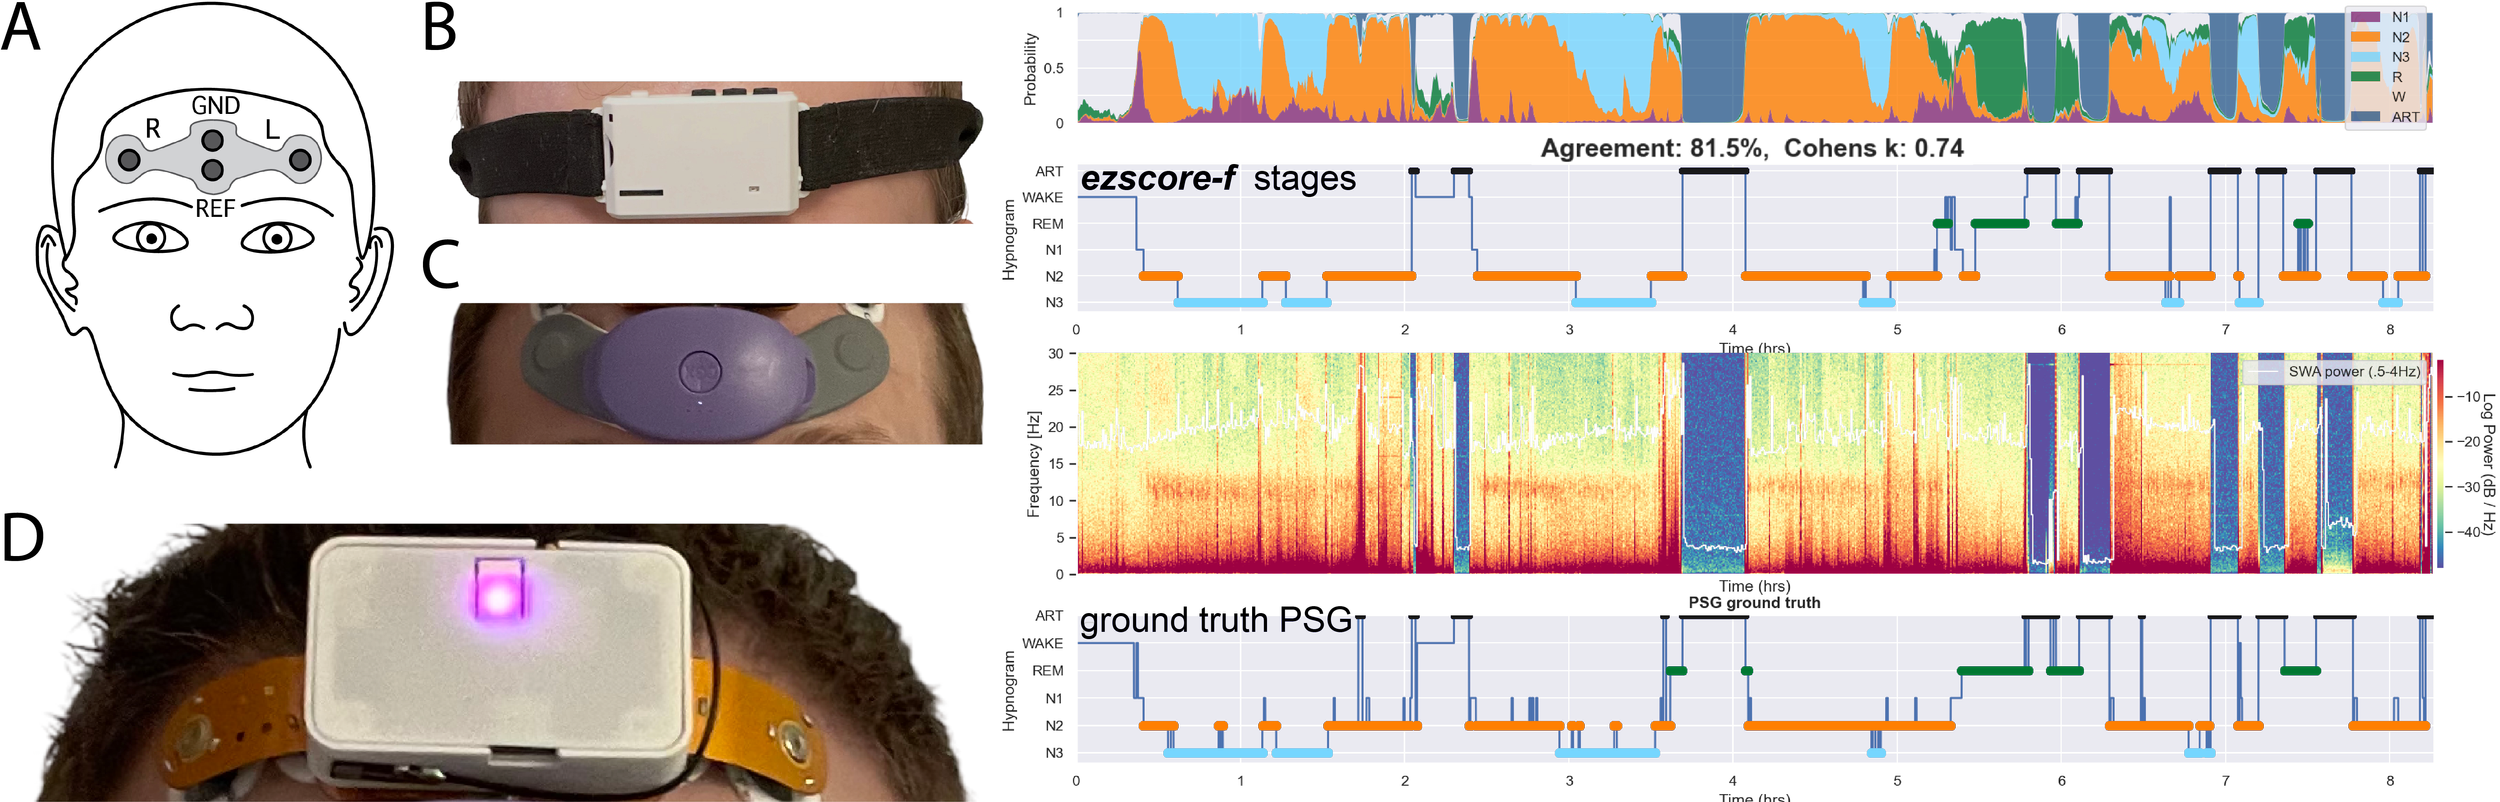
ezscore-f: Pretrained artifact-aware sleep stage classifiers for forehead EEG
Pretrained artifact-aware sleep stage classifiers for forehead EEG.
ezscore-f is for 2-channel forehead EEG, and is artifact-aware. ezscore-f automatically detects and isolates signal artifact commonly encountered in forehead EEG devices. Figure from Coon et al. 2025: ezscore models were trained on ZMax data and validated on ZMax (B) and DCM (D) data. CGX (C) validation is in-progress (coming soon!). 🚨🚨Note that CGX is NOT yet officially supported🚨🚨.
Pretrained artifact-aware sleep stage classifiers for forehead EEG.
📦 Ready-to-use model checkpoints
📈 Supports real-time and offline scoring
🧪 Artifact-aware: isolates artifact for robust, accurate sleep staging
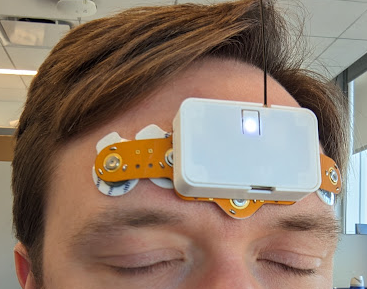
DCMini is a miniaturized biopotential amplifier and multi-sensor system designed for research applications in brain-computer interfaces (BCI), muscular interfaces, and closed-loop biofeedback. It combines a flexible set of sensors with powerful wireless telemetry and SD logging — in a package you can stick on your head.
Continual Learning in A.I. benefits from three sleep mechanisms: NREM, REM and Synaptic Downscaling

Continual Learning in A.I. benefits from three sleep mechanisms: NREM, REM and Synaptic Downscaling (arXiv preprint here). In A, we see a conceptual visualization of sleep’s synaptic downscaling process — a size-dependent reduction in the magnitude of synaptic connections or weights, thought to be responsible in biological brains for metabolic maintenance, neural upkeep, and fine-tuning signal-to-noise ratios in neural networks. B and C show the effect of introducing downscaling to an artificial neural network performing a sequential learning task. The network undergoes interleaved periods of veridicial memory replay (akin to NREM sleep) and generative memory replay (akin to REM sleep; C, red bar), or those processes plus synaptic downscaling (C, blue bar). Looking at the distribution of learned data represented by the colors inside each bar in C, we observe that the tripartite sleep model causes a re-balancing of learning, recovering data learned in the distant past while allowing new data to be learned in the future. The waterfall plots on the right show the same effect, but as a function of “time”, showing how this rebalancing evolves over the course of the network’s “sleep”.
Custom Data Visualization & Animation
Cortically generated slow oscillations initiate a sequence of events that facilitate memory consolidation during sleep. These begin with a cortically synchronized hyperpolarizing burst, which is reflected by the sharp downward deflection of the slow oscillation's inhibitory "downstate". The downstate is followed by an excitatory "upstate" lasting several hundred milliseconds. During the upstate rebound, sleep spindles, which are propagated through thalamocortical circuits, bind distant cortical regions together to facilitate the transfer of memory engrams stored in temporary stores in hippocampal circuits to long-term storage in cortical destinations. The entrainment of widespread cortical areas by spindles may support the integration of newly formed (hippocampal) memories with prior experience, context, and skills acquired by the organism throughout its life. Hippocampal ripples reflect this outward flow of information from the hippocampus to the cortex, and are organized into discrete "packets" of activity that occur during the troughs of spindle oscillations. Isolated ripple events may reflect a strengthening of synaptic connections (memory consolidation), while sequentially occuring burts of ripple doublets or triplets may support pattern completion (memory post-processing). So in summary, triple phase locking between cortical slow oscillations, thalamocortical spindles, and hippocampal ripples together mediates memory processing during (NREM) sleep.
Animation copyright Will Coon (2019), inspired by and adapted from Born & Wilhelm (PNAS) 2012.
Cortical Activity Onset Detection in Single Trials (Electrocorticography — “ECoG”)

Fig. 2 (from Coon et al. 2016). Exemplary spatiotemporal trajectory of task-related neuronal population activity in one single trial. A) Task-related cortical locations from Subject A (left), and the time course of neuronal population activity in exemplary locations (right). Increases in activity at each location are brief. B) Population-level activity occurs during the trough of alpha oscillations (8–12 Hz)

Fig. 4 (from Coon & Schalk 2016). Single-trial detection framework for determining where and when task-related neuronal population activity occurs. (A) Analysis of signal variance (see Methods) in each channel, time-locked to stimulus onset and averaged across trials, identifies locations with activity that was modulated by the task. Task-related locations will exhibit a total variance in the signal much greater than the variance of binned subsections of the same time series (ratio ≫1; bars depict variances). In locations not related to the task, these variances are approximately the same (ratio ≈ 1). Task-related locations are defined as those with statistically significant activation ratios ((B); see text for statistics). (C) The time course of broad- band activity in one trial from one location. For each location, the detection algorithm optimizes a channel-specific threshold by scanning through a series of values applied to all trials ((D) and selecting the threshold value that maximizes the difference between the number of hits detected in the task vs. the baseline period (bar graph in Fig. 4D). In a final step, the algorithm refines its estimates of task-related locations by determining which locations had a statistically significant increase in the number of detected onsets in the task period as compared to the baseline period. This information is used to further refine the previously identified network, resulting in a final definition of the task-related network (arrow to B from subpanel in D).